Monitoring
Configure Container Insights (CloudWatch)
In this section, we’ll need to configure some settings before using Container Insights. Container Insights is a service that allows us to monitor metrics such as CPU usage, Network activity, and more, giving insight into user activity over a certain period.
Combined with CloudWatch, we can view logs sent from Containers in groups, usually with the prefix /ecs/*. This gives a more comprehensive view of applications in the system—how they’re running, any alerts, and the ability to read logs for troubleshooting errors or investigating unusual traffic when the system is compromised.
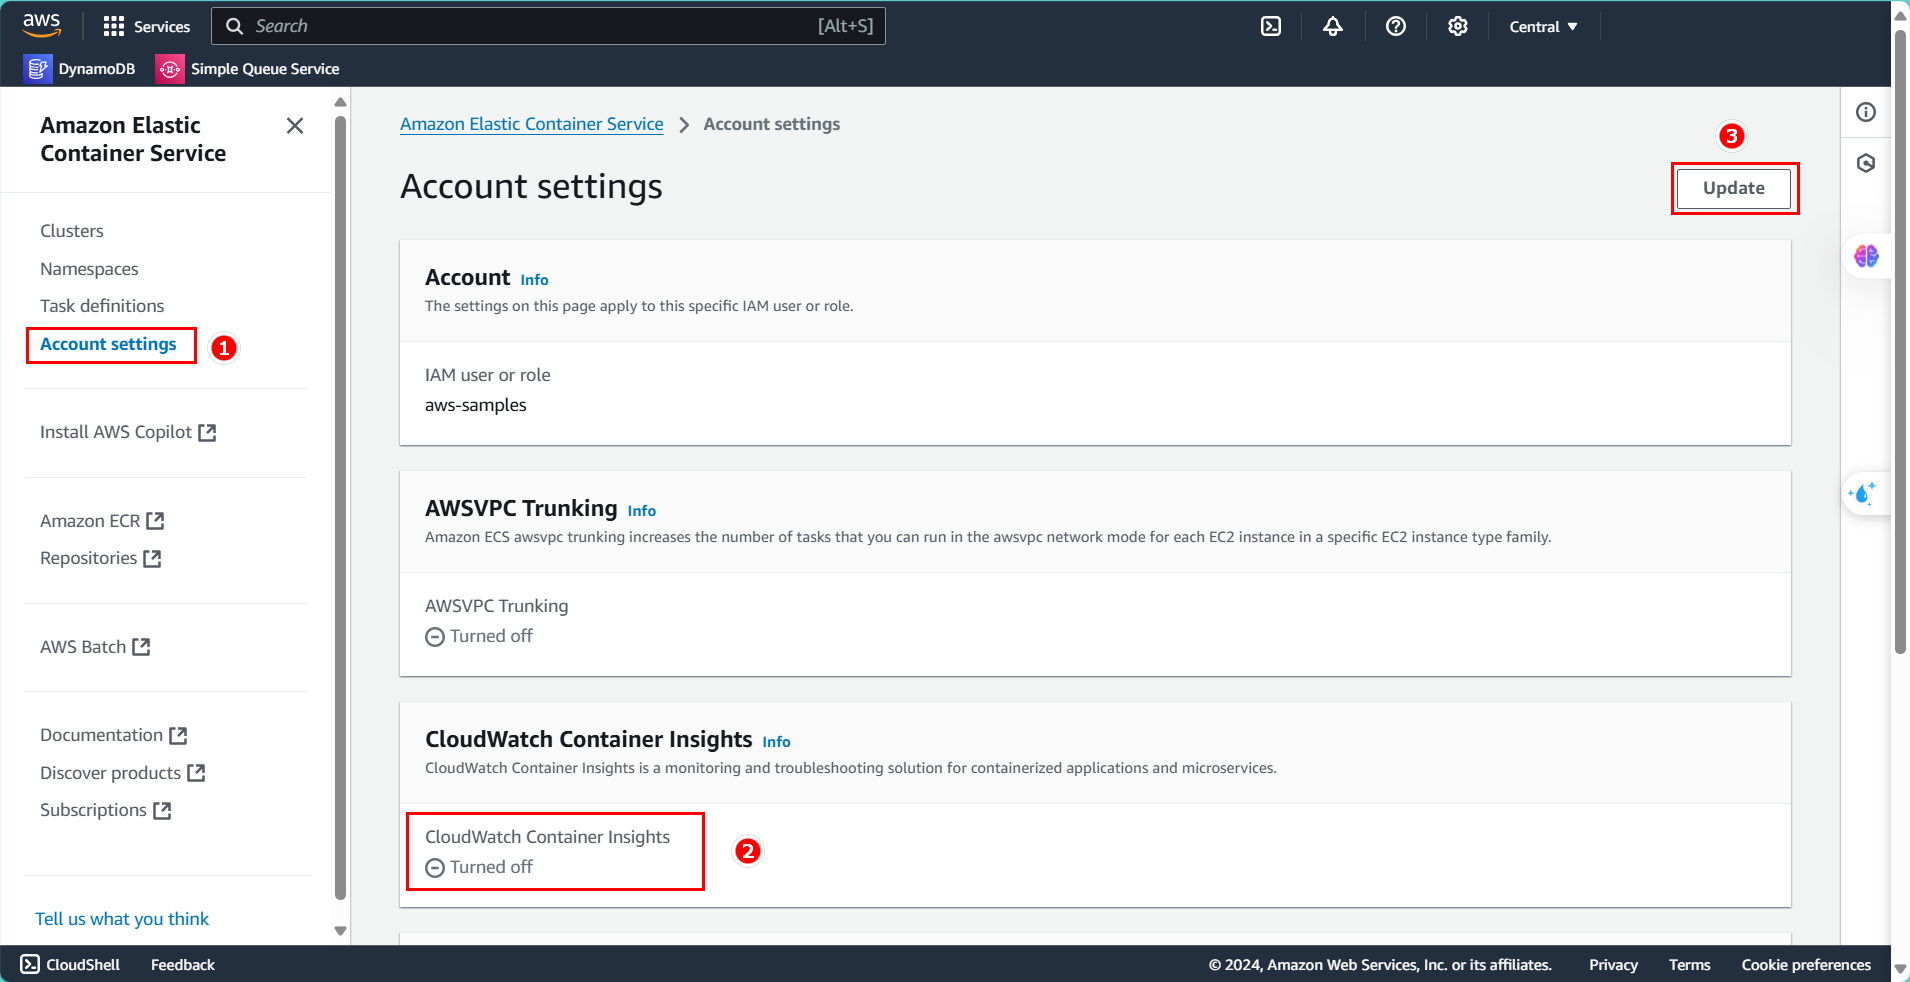
- On the ECS console page, in the right-hand menu, select Account settings.
- Choose Update.
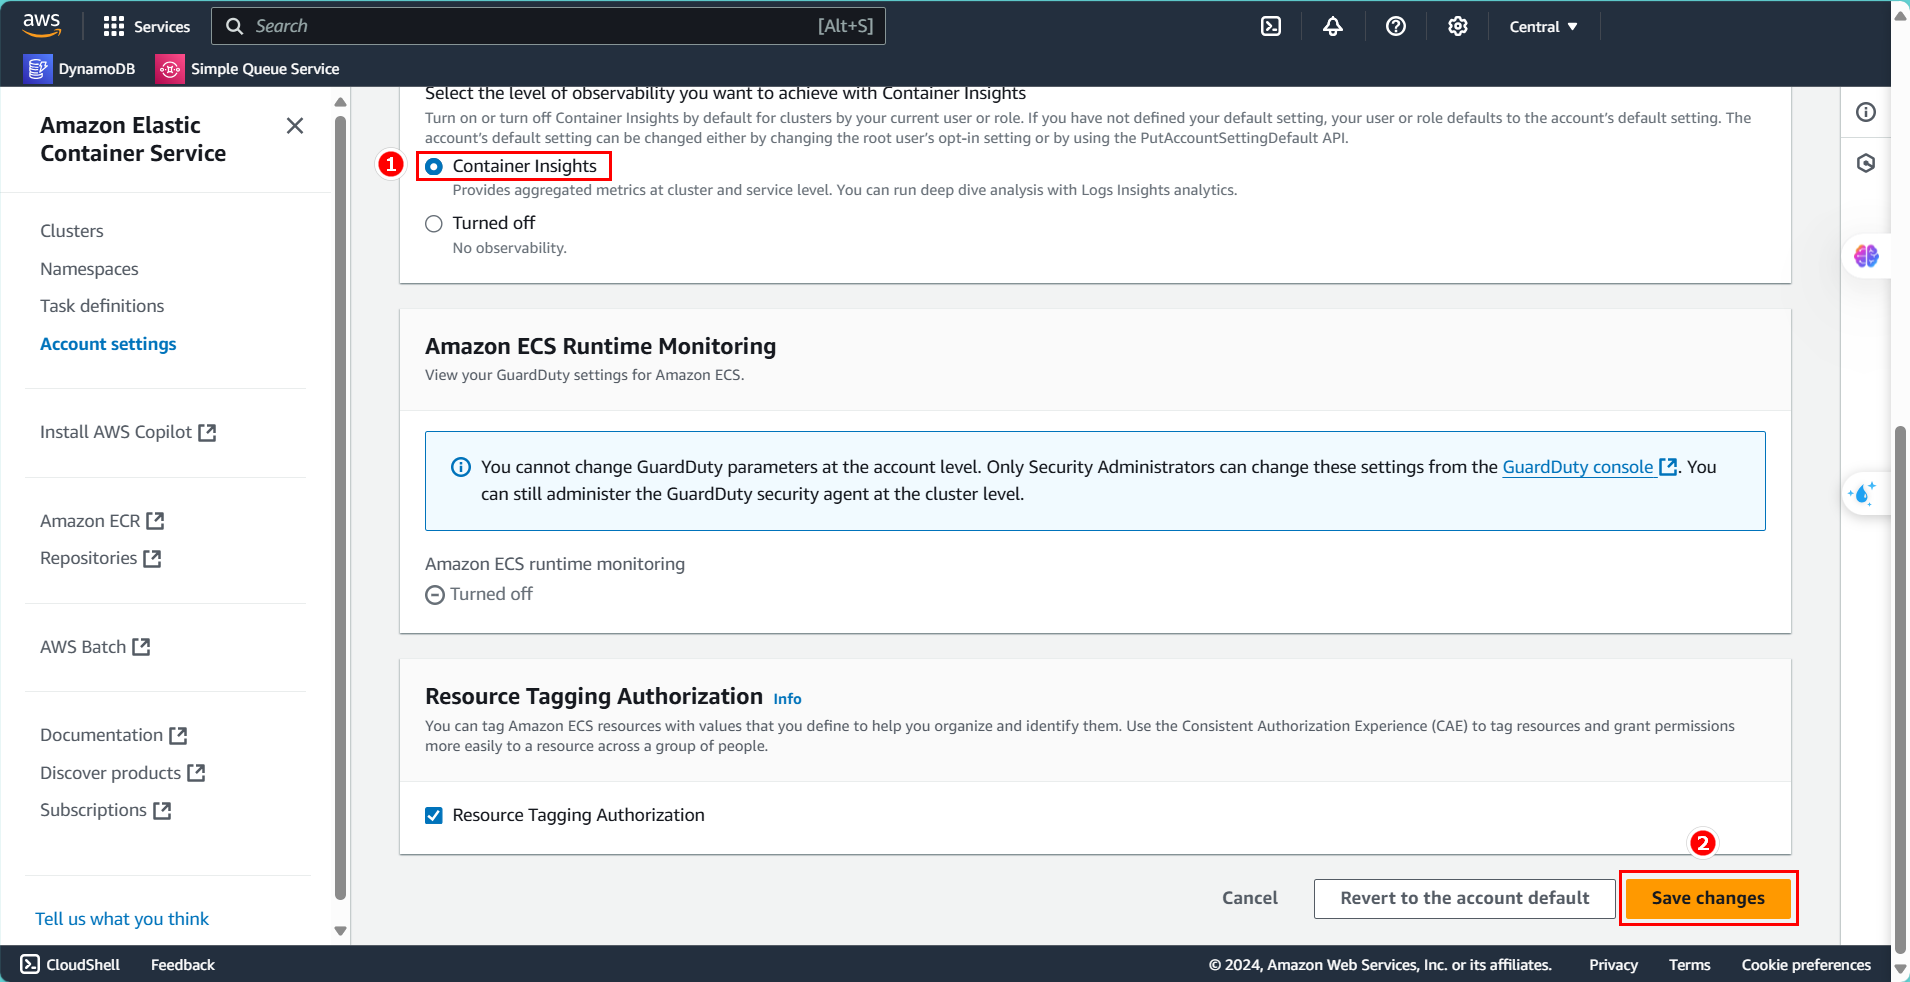
- Select Container Insights.
- Click Save changes.
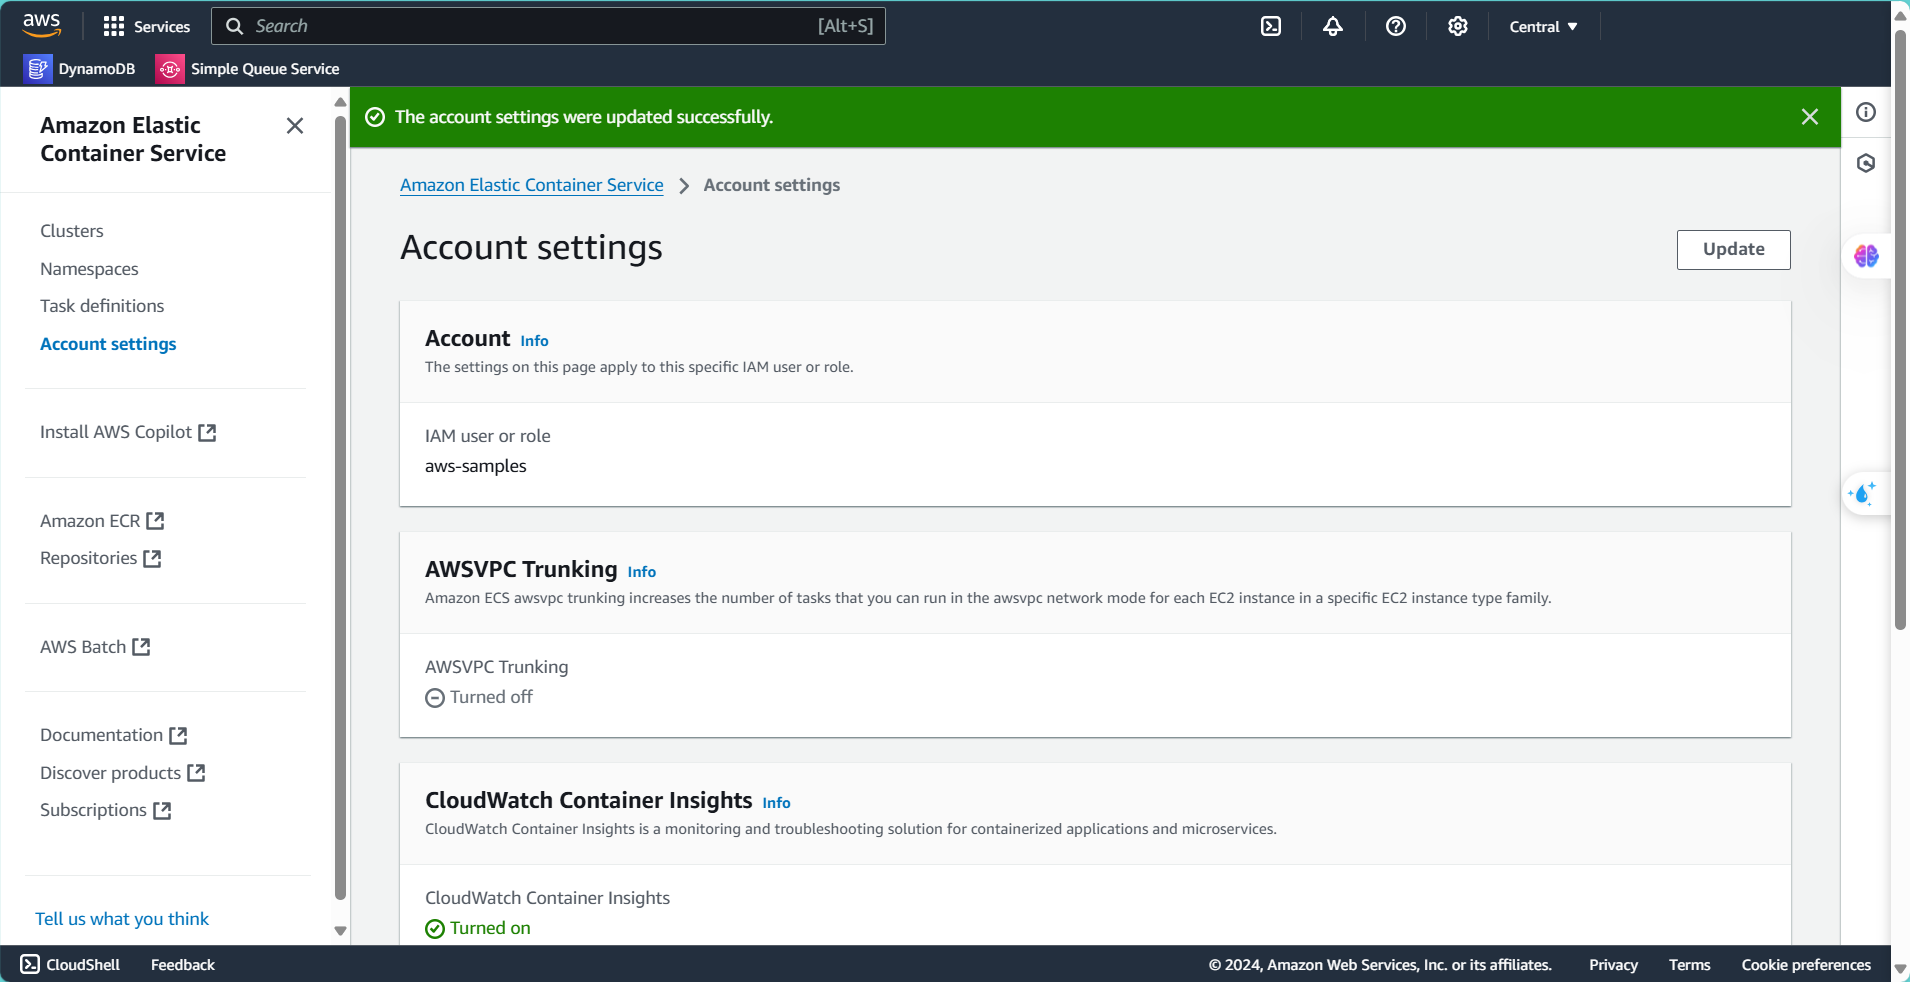
- Complete the Container Insights configuration.
Observing Metrics with Performance Monitoring
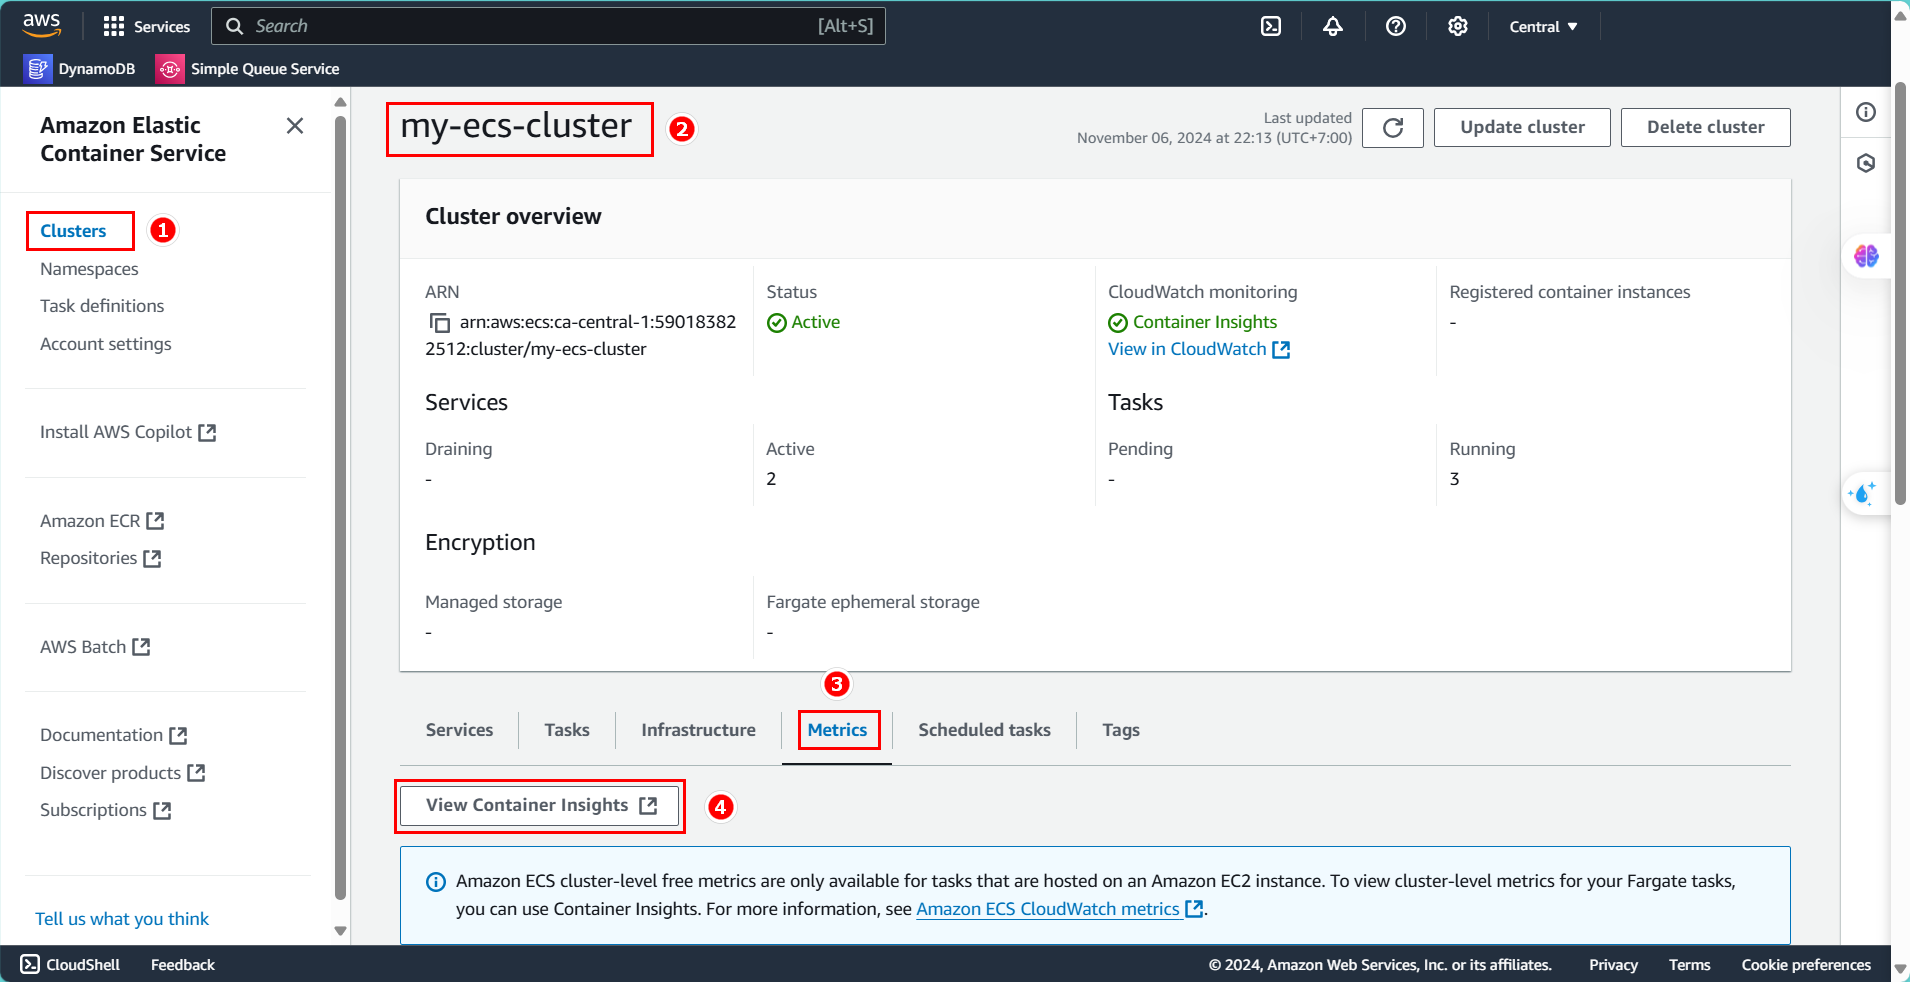
- Go back to Clusters.
- Select Metrics.
- Click on View Container Insights to observe metrics.
- View the metrics with ECS.
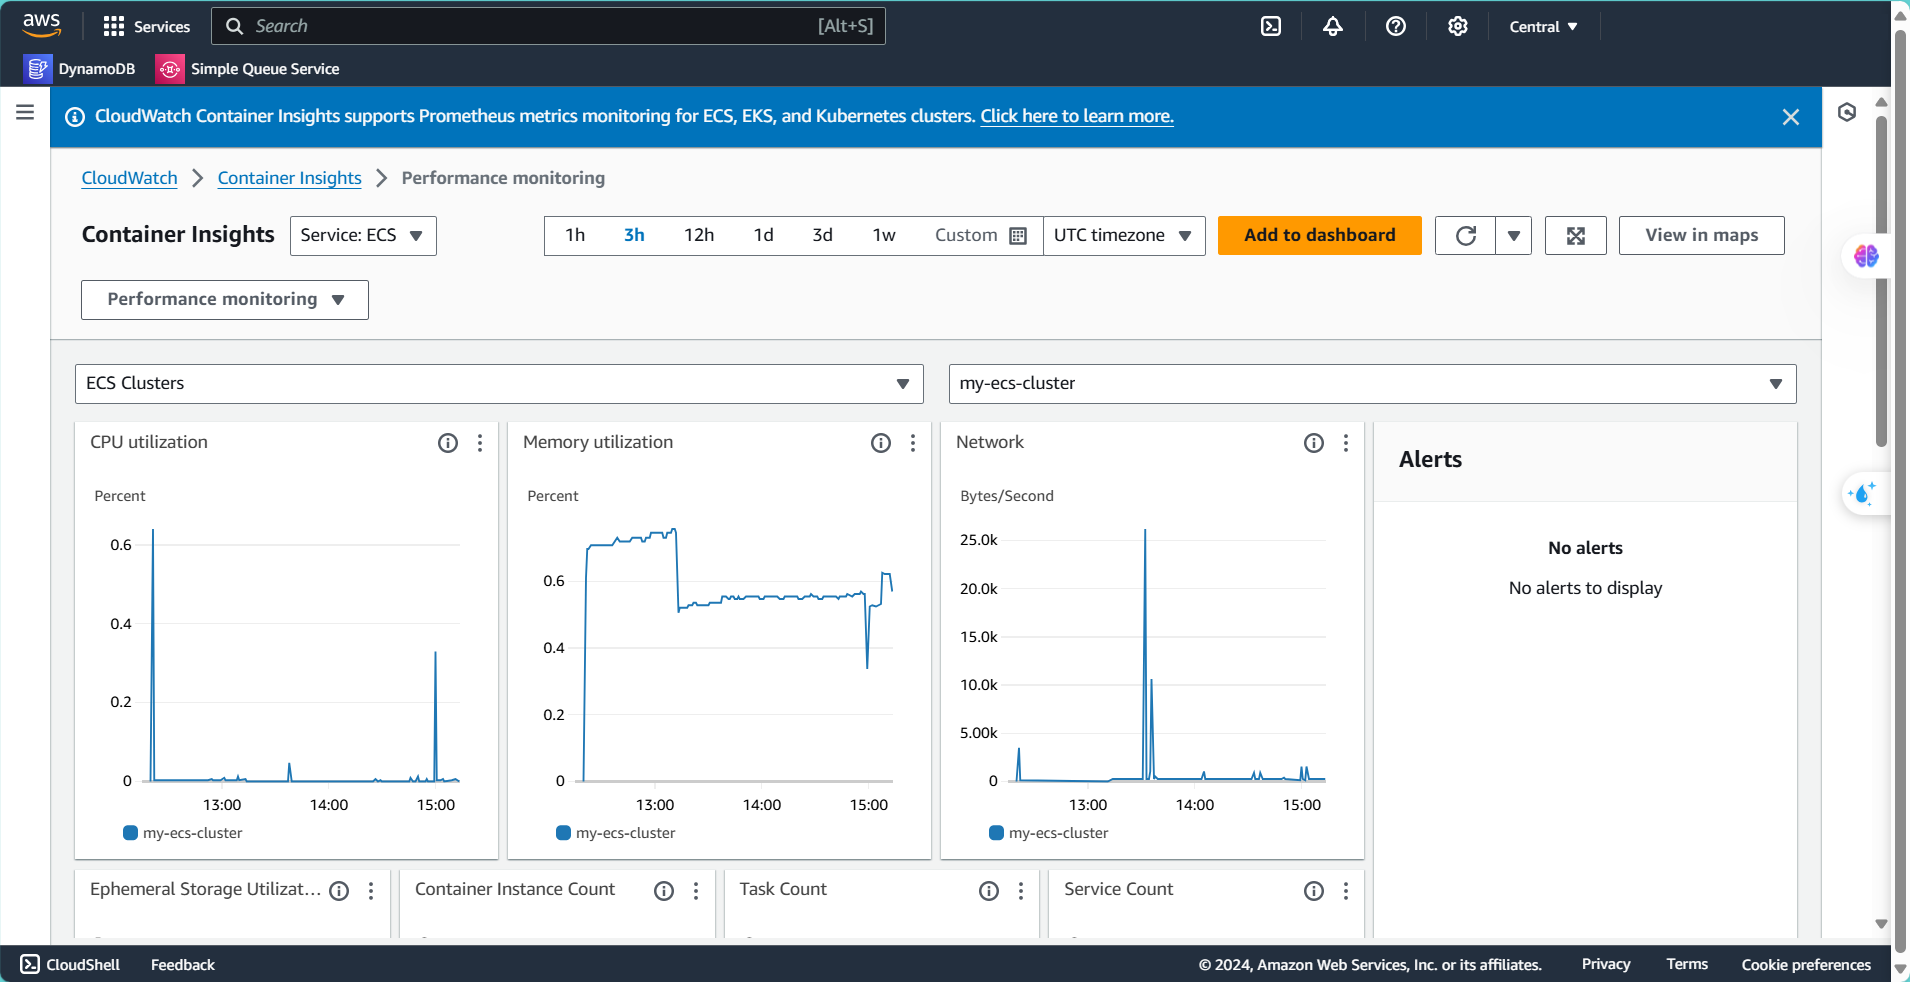
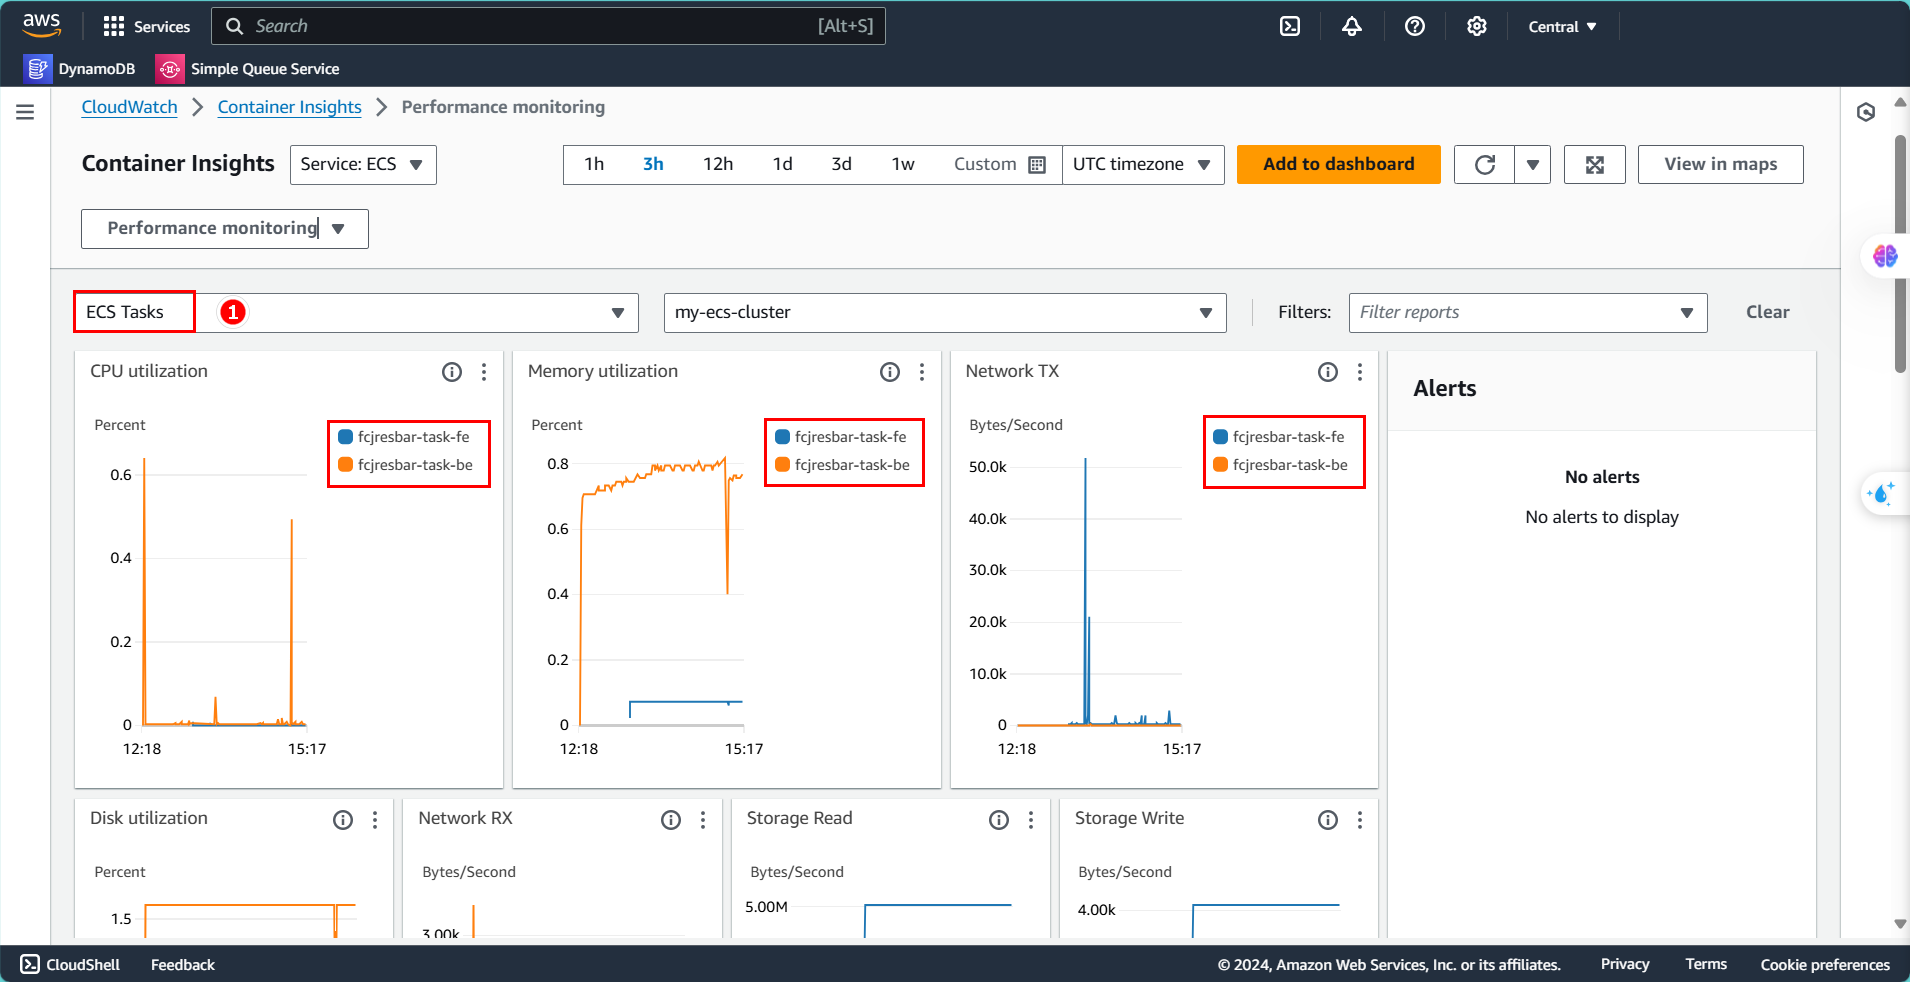
To switch to observing Task definitions, follow these steps:
- In the highlighted section, change it to ECS Tasks to monitor events there.
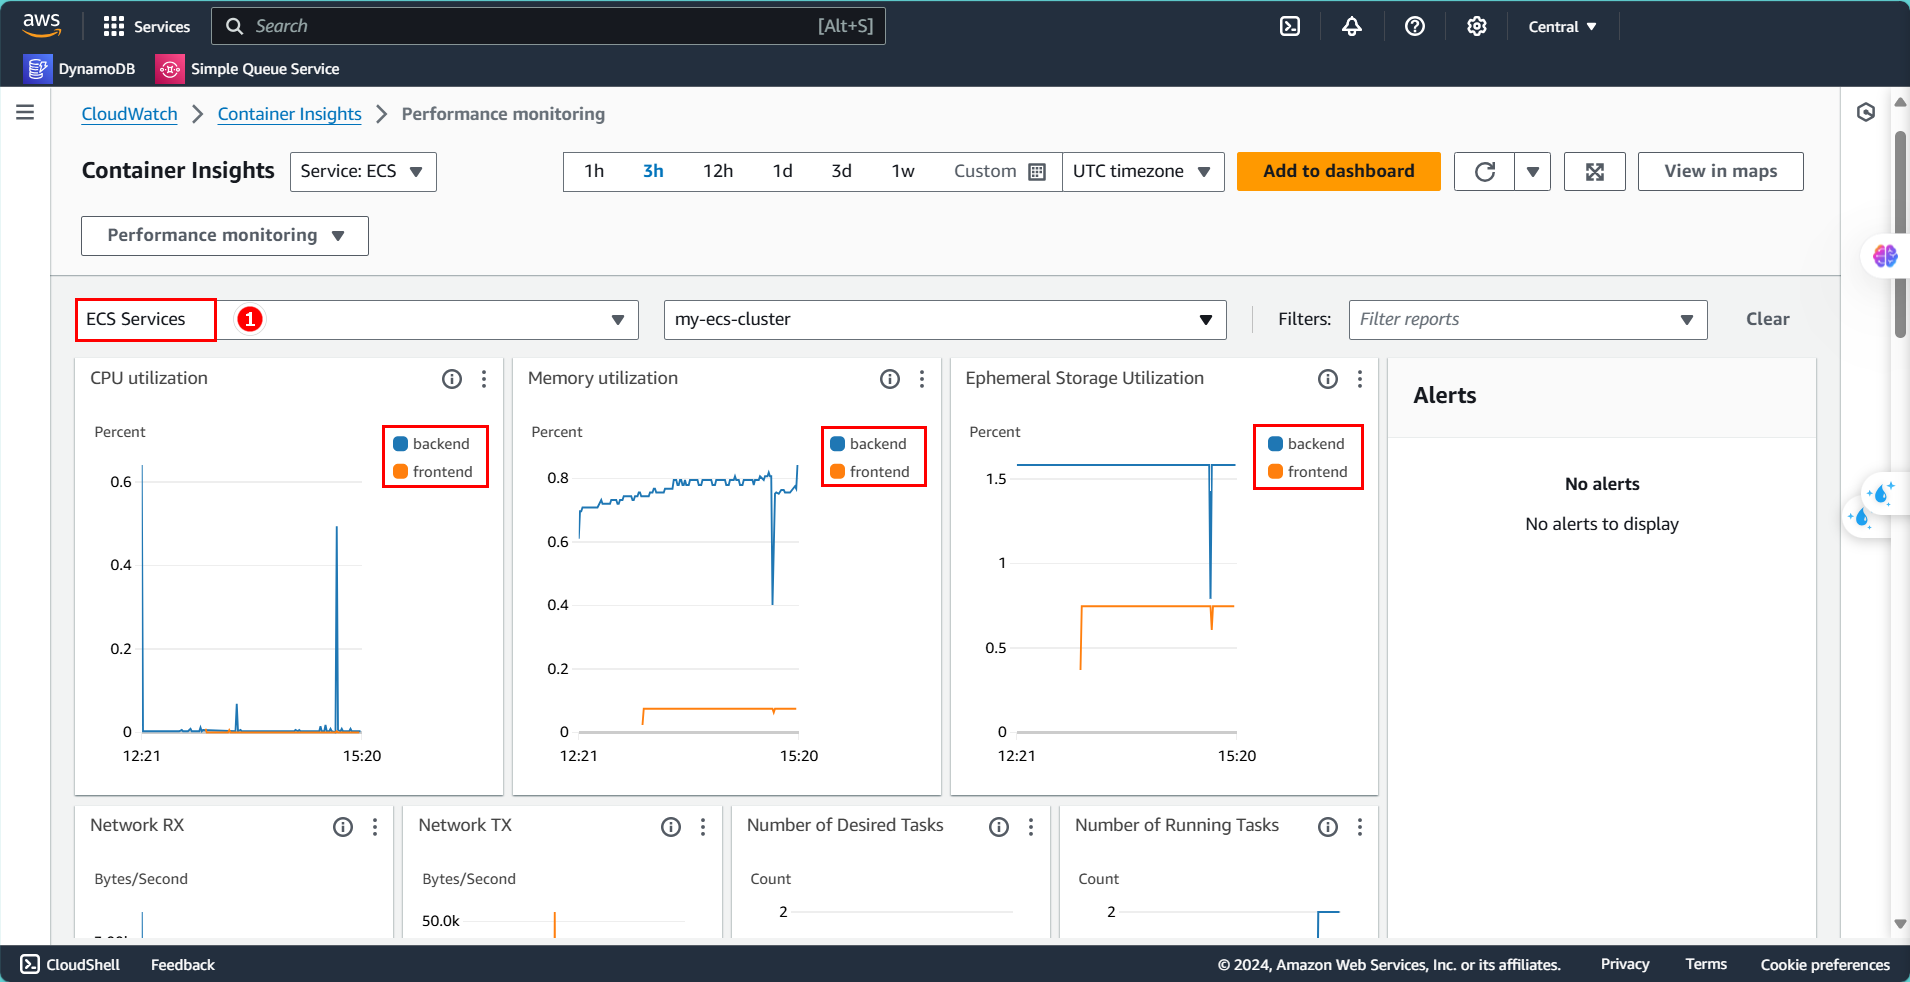
Similarly, to view events for ECS Service:
- In the highlighted section, change it to ECS Service to monitor those events.
Observing Metrics with Container Map
Here, you can view which Containers, Tasks, and Services are running within the Cluster you’ve deployed, with greater specificity.
- Change Performance Monitoring to Container Map.
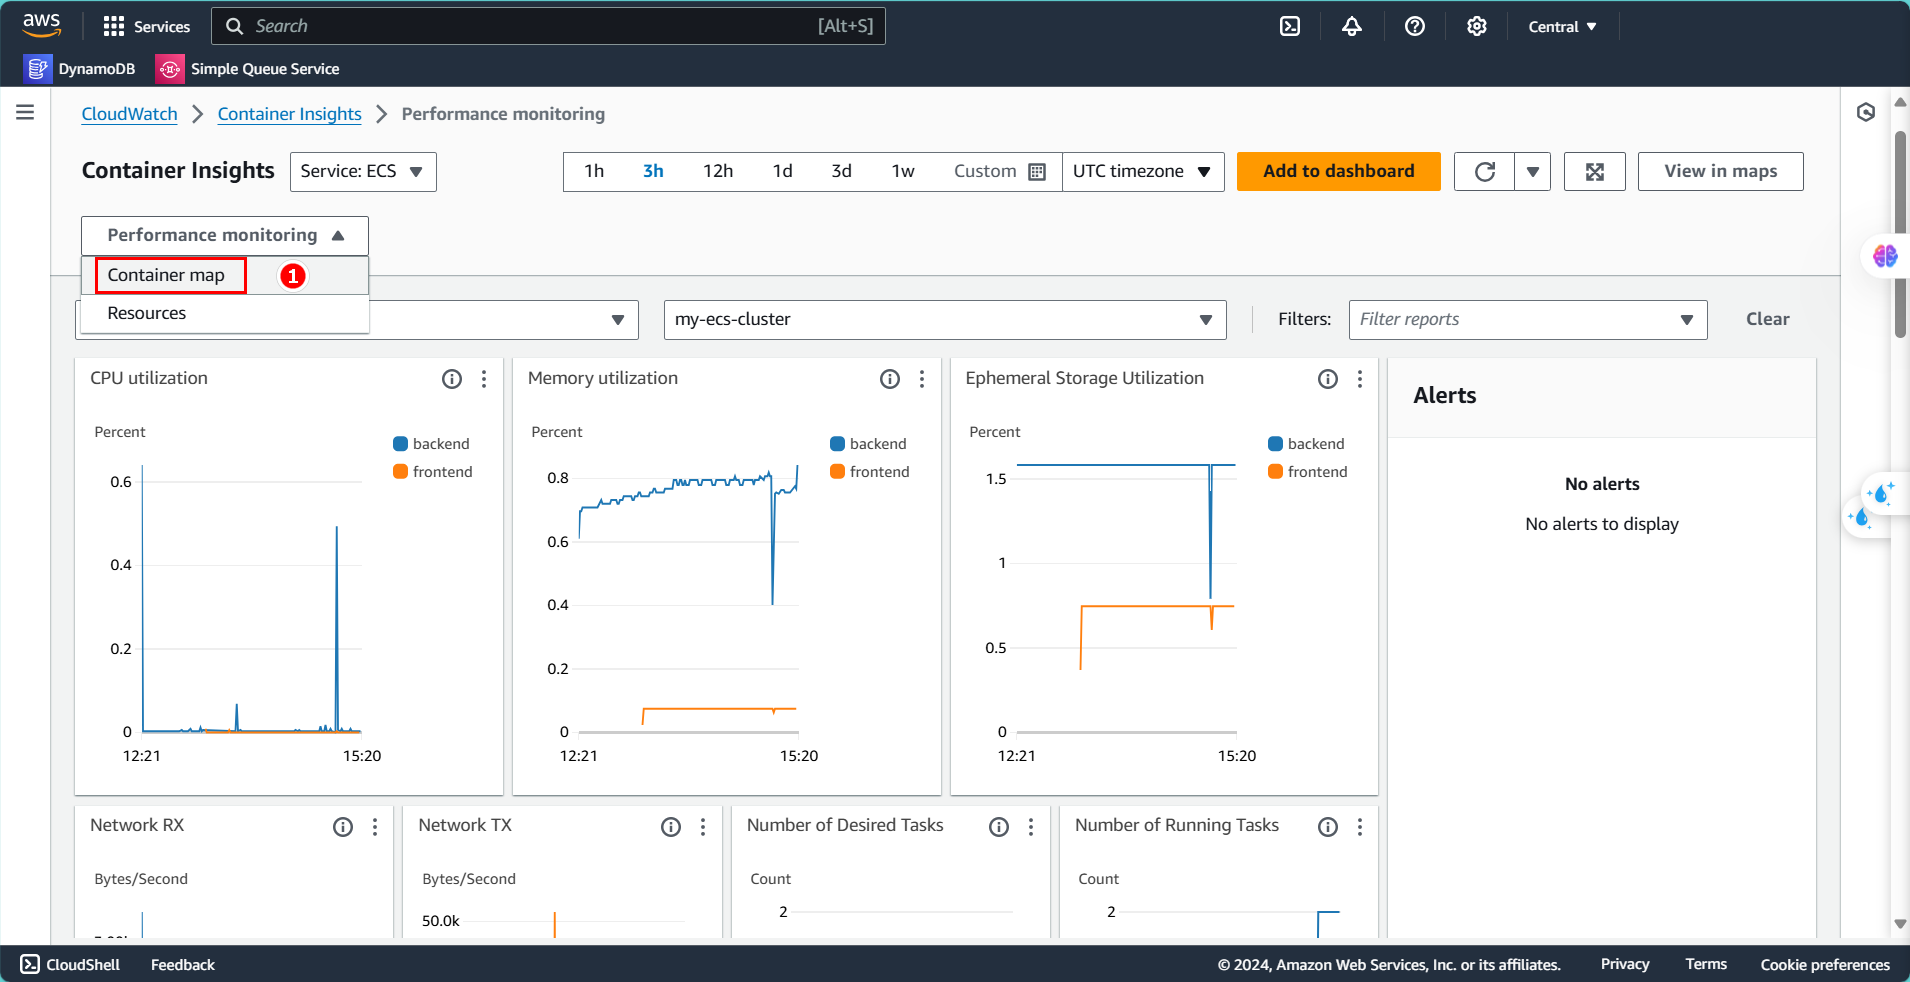
You’ll see a new interface showing how a Cluster manages related resources like Services and Tasks. Note that metrics within a Task differ from those within a Service, as Services directly manage Tasks, meaning Task metrics are also applicable to Services.
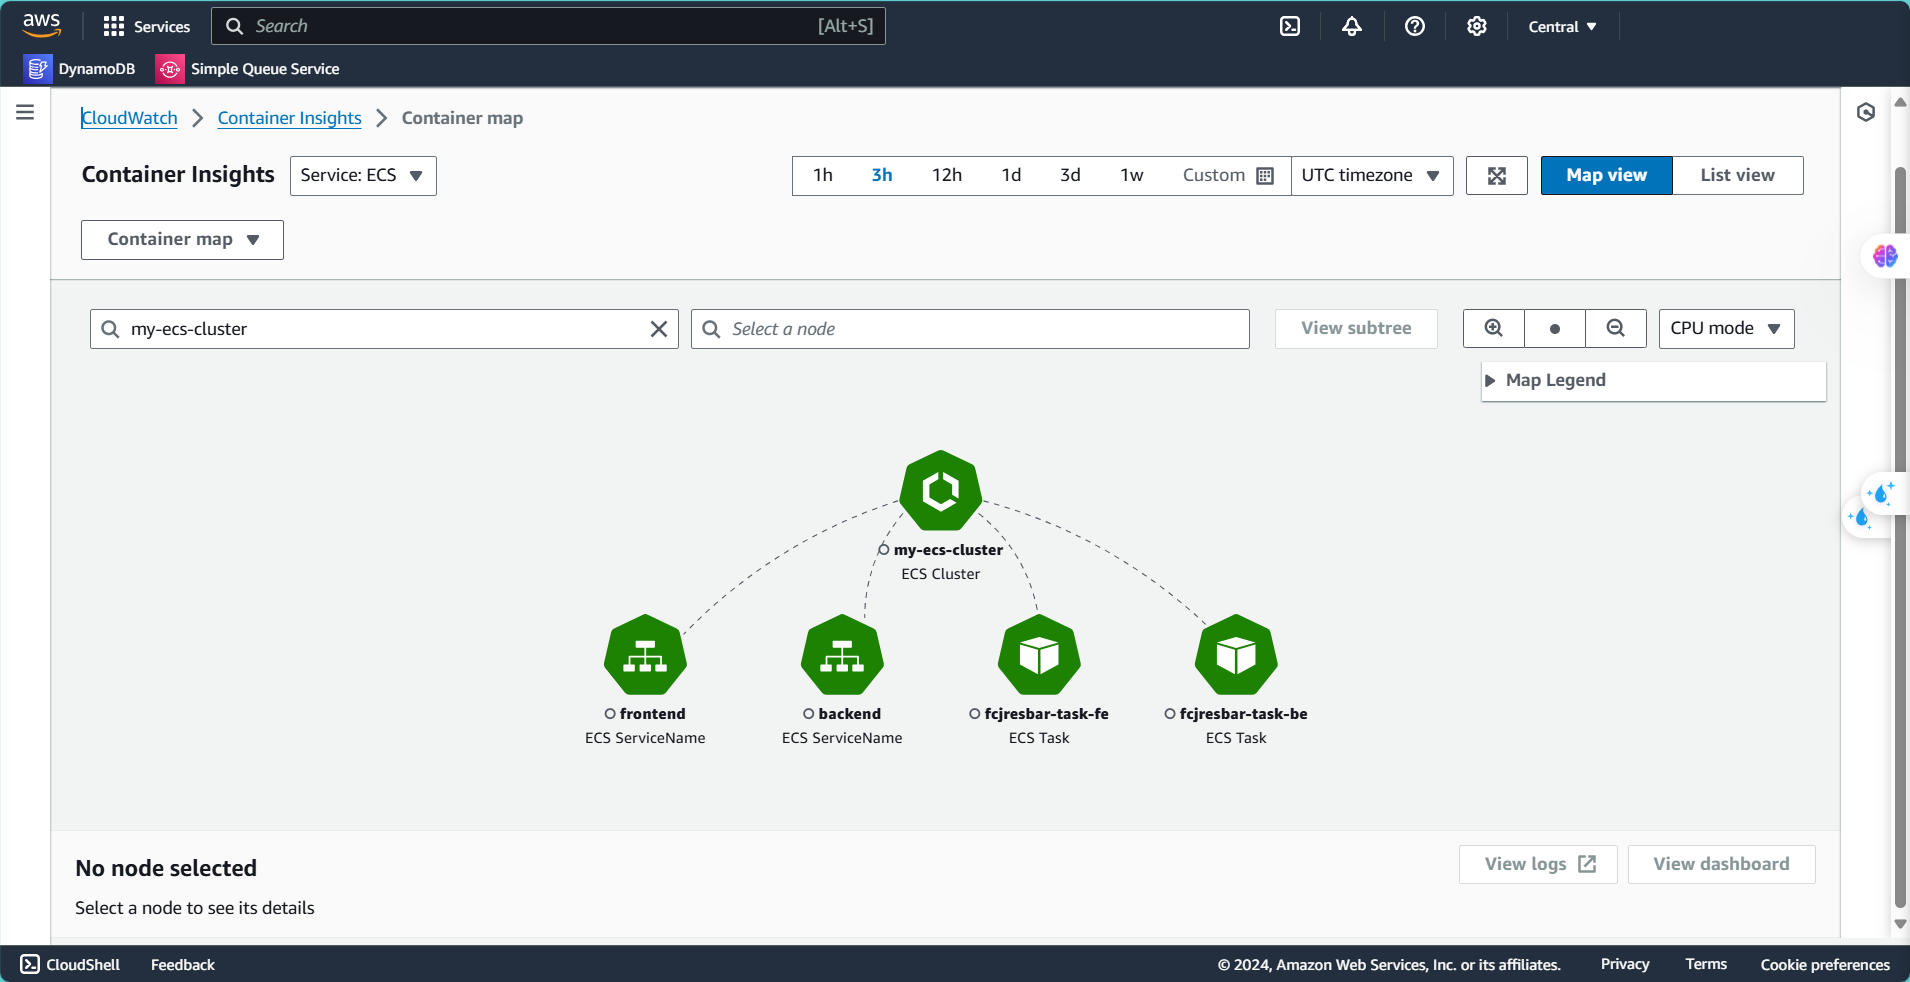
Here, you can also view details for each service.
- Click on Service backend.
- Select Metrics.
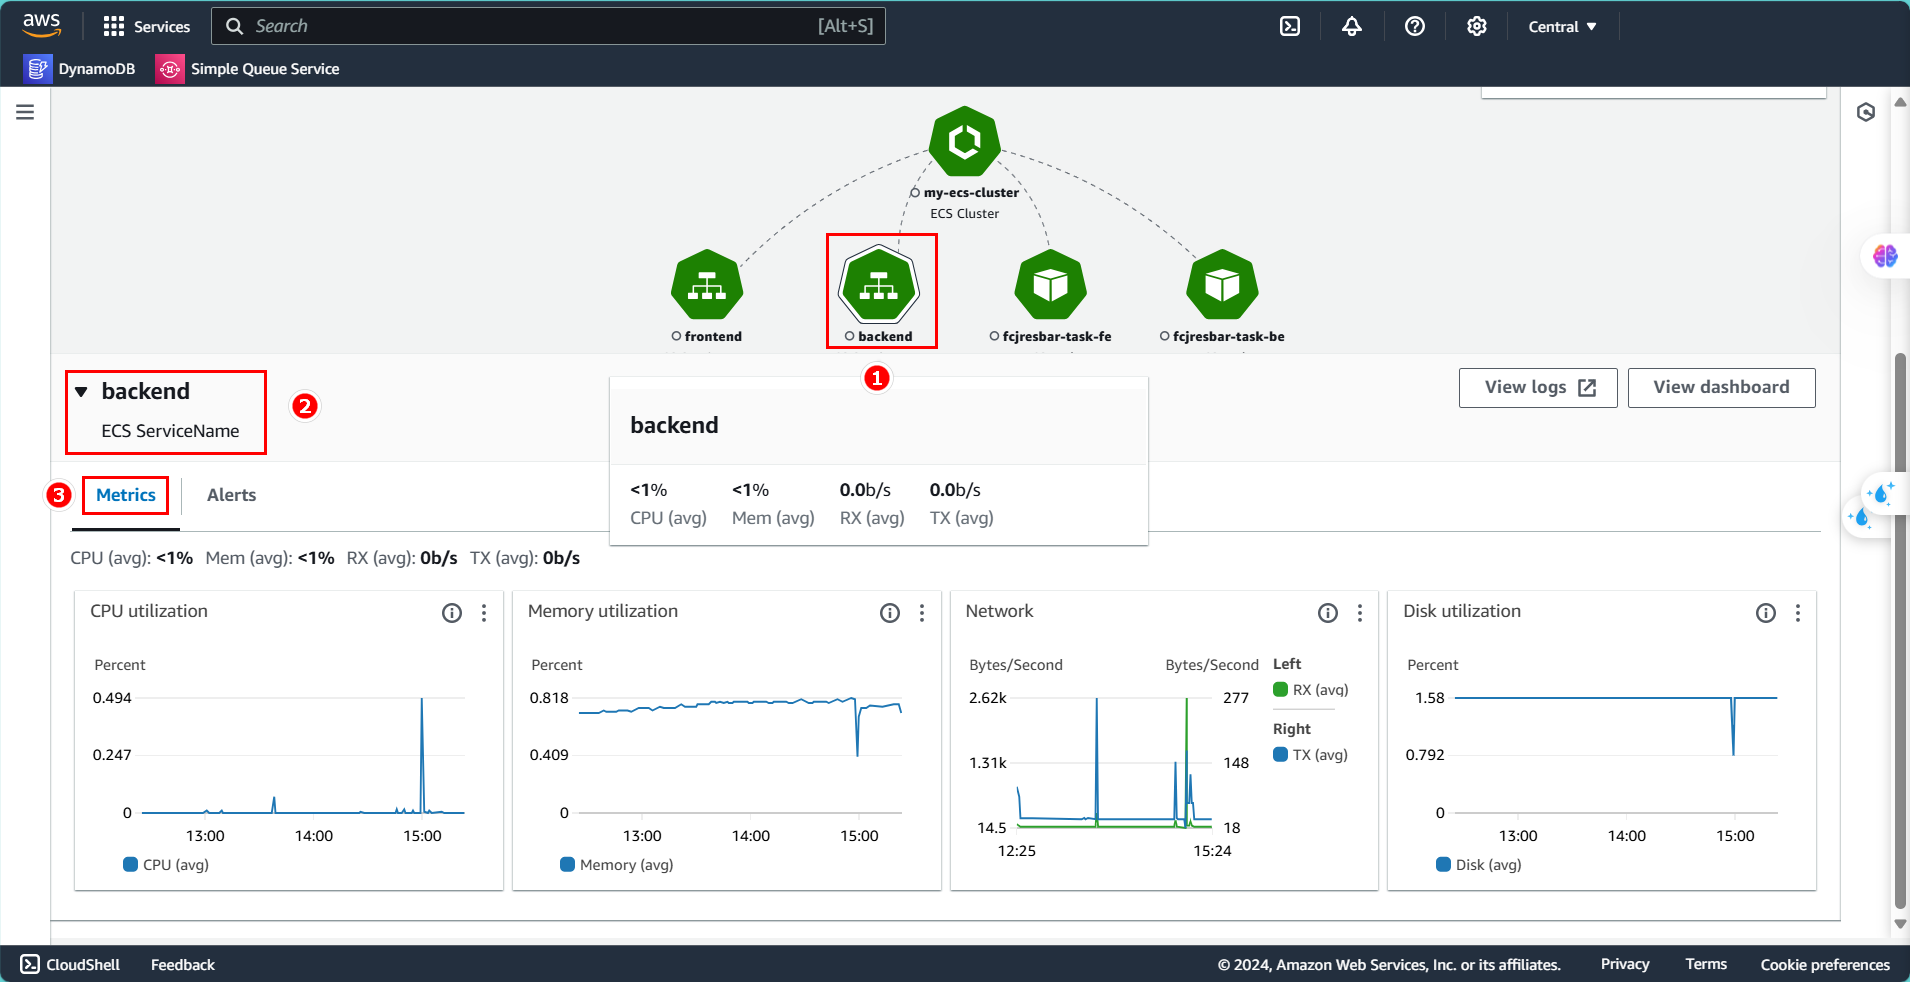
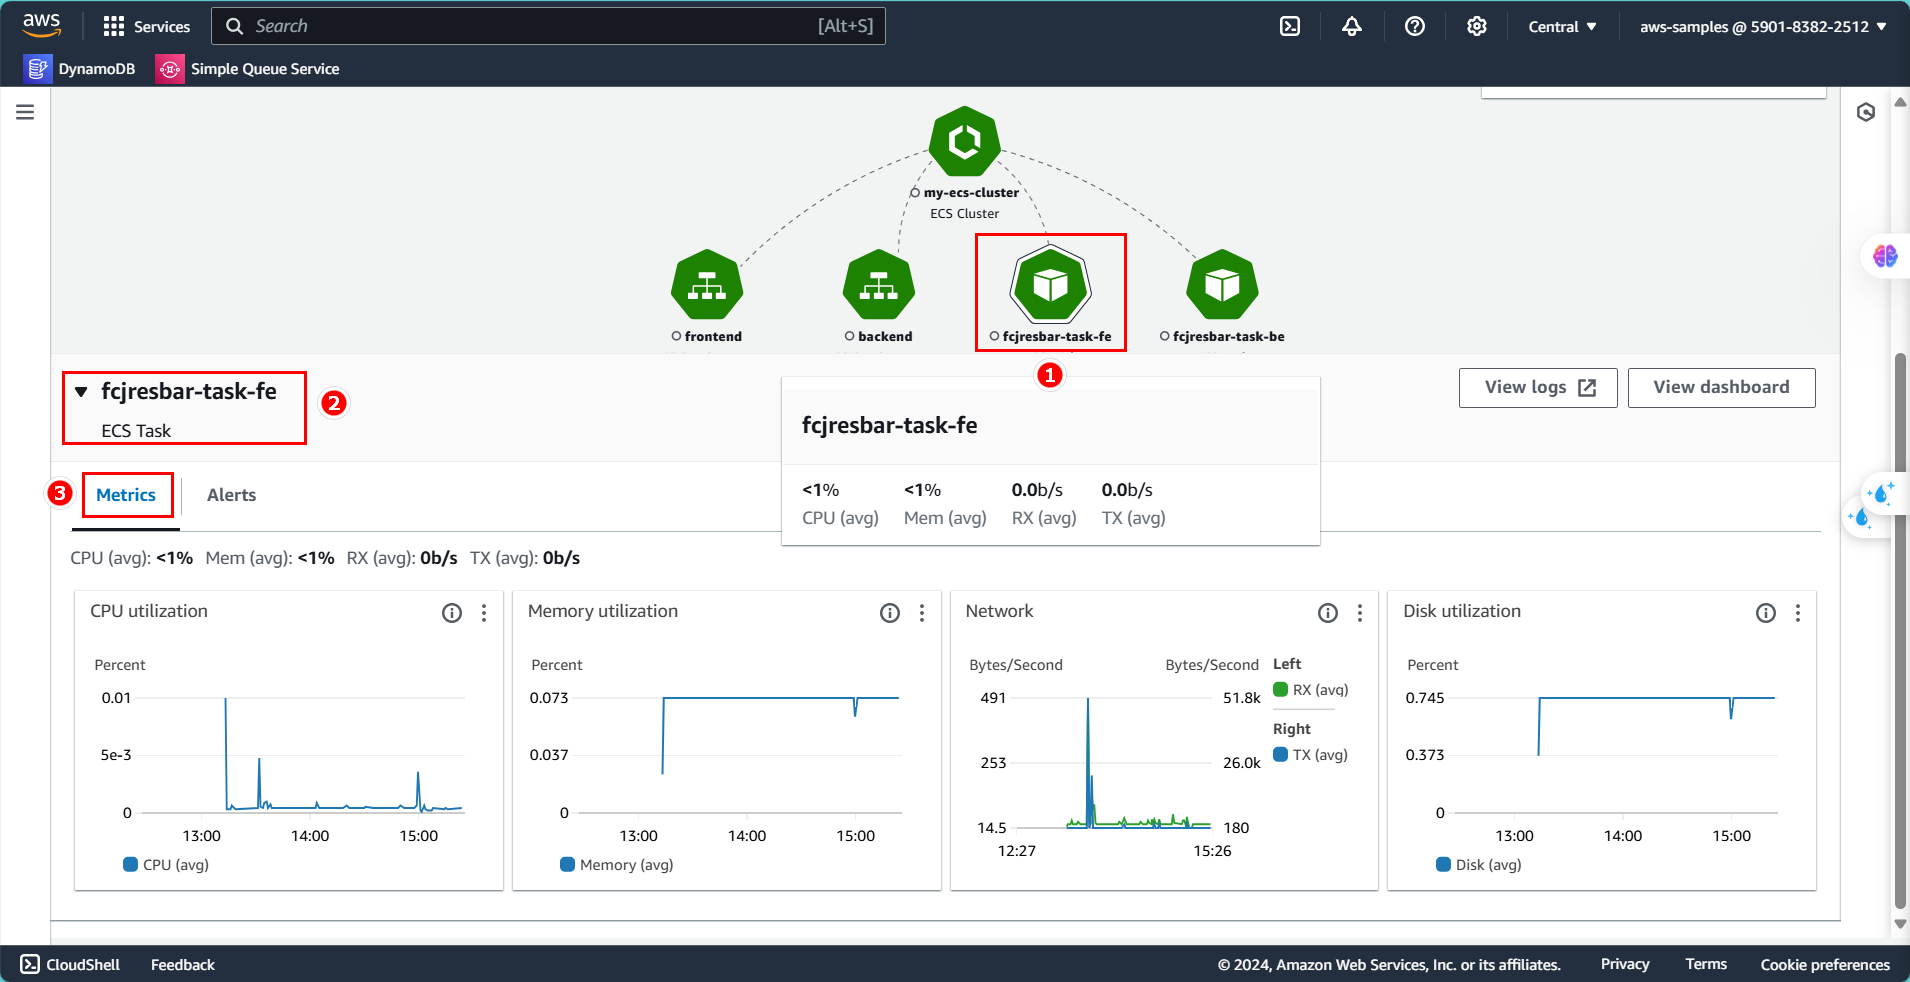
Similarly, you can view Task definitions:
- Click on Task fe.
- Choose Metrics.
Observing Metrics with Resources
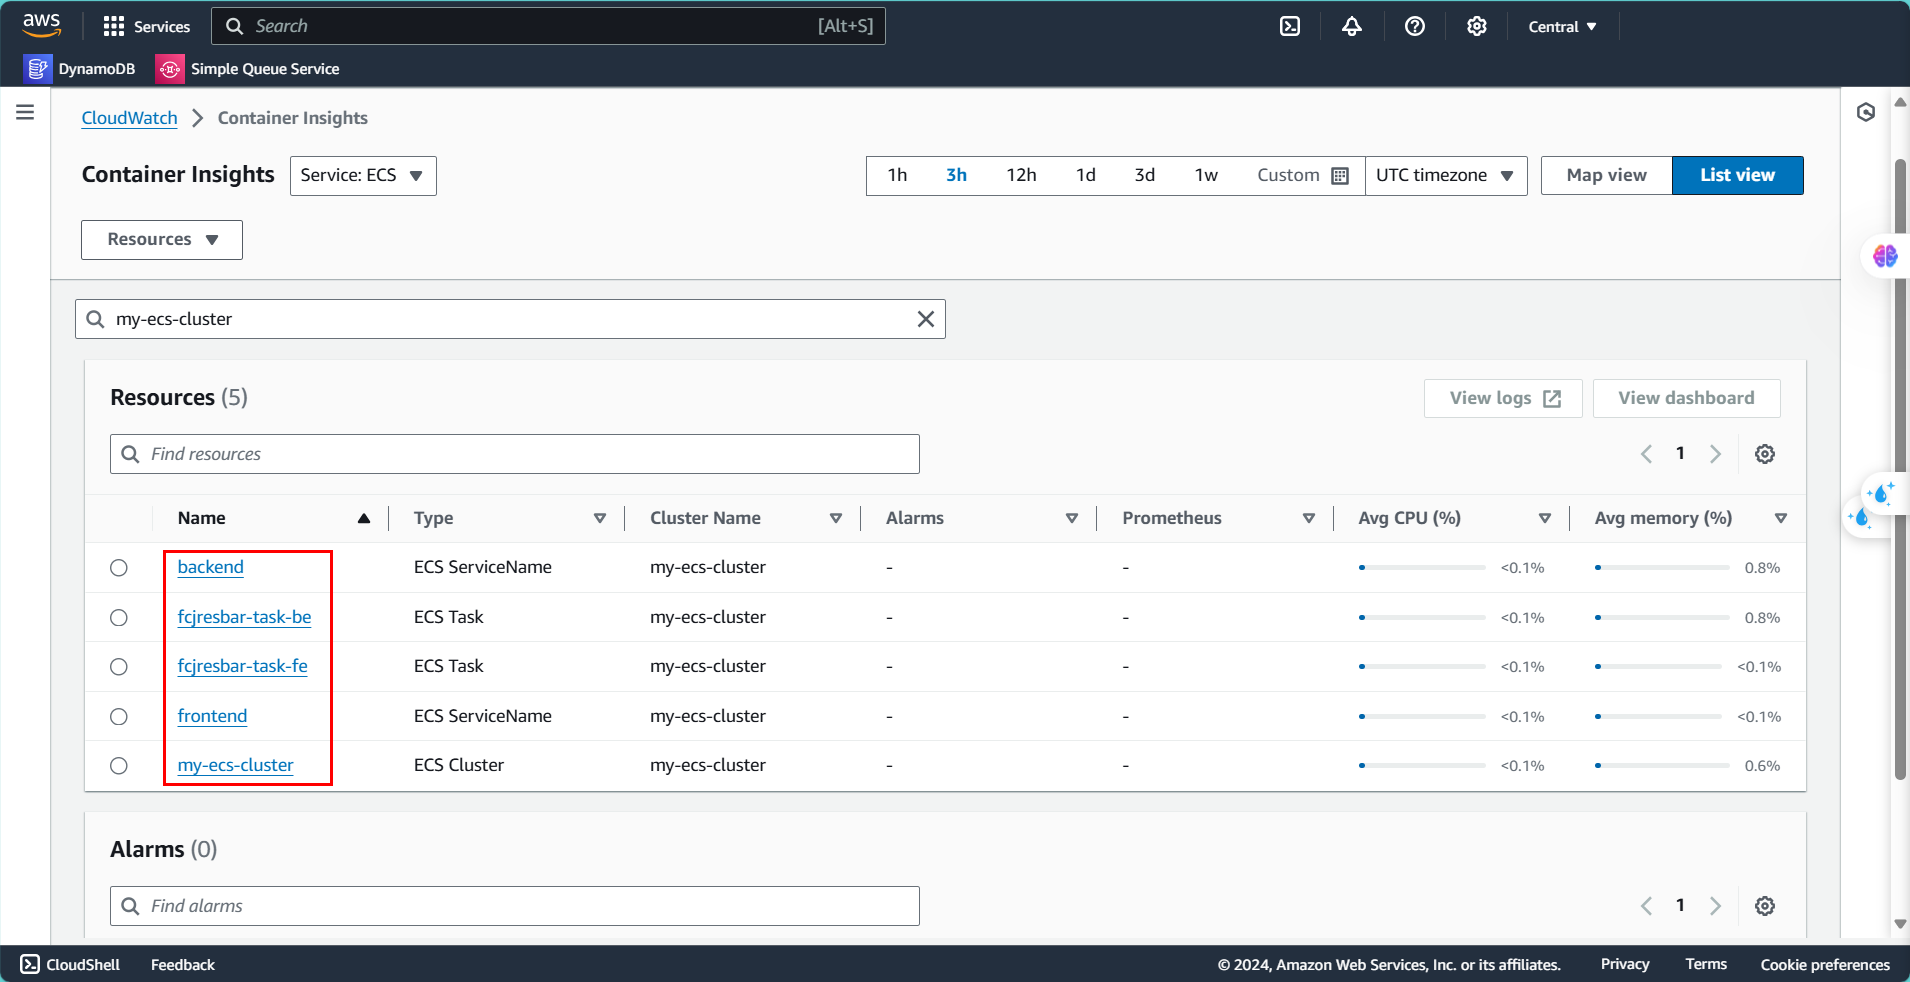
- Change Container Map to Resources.
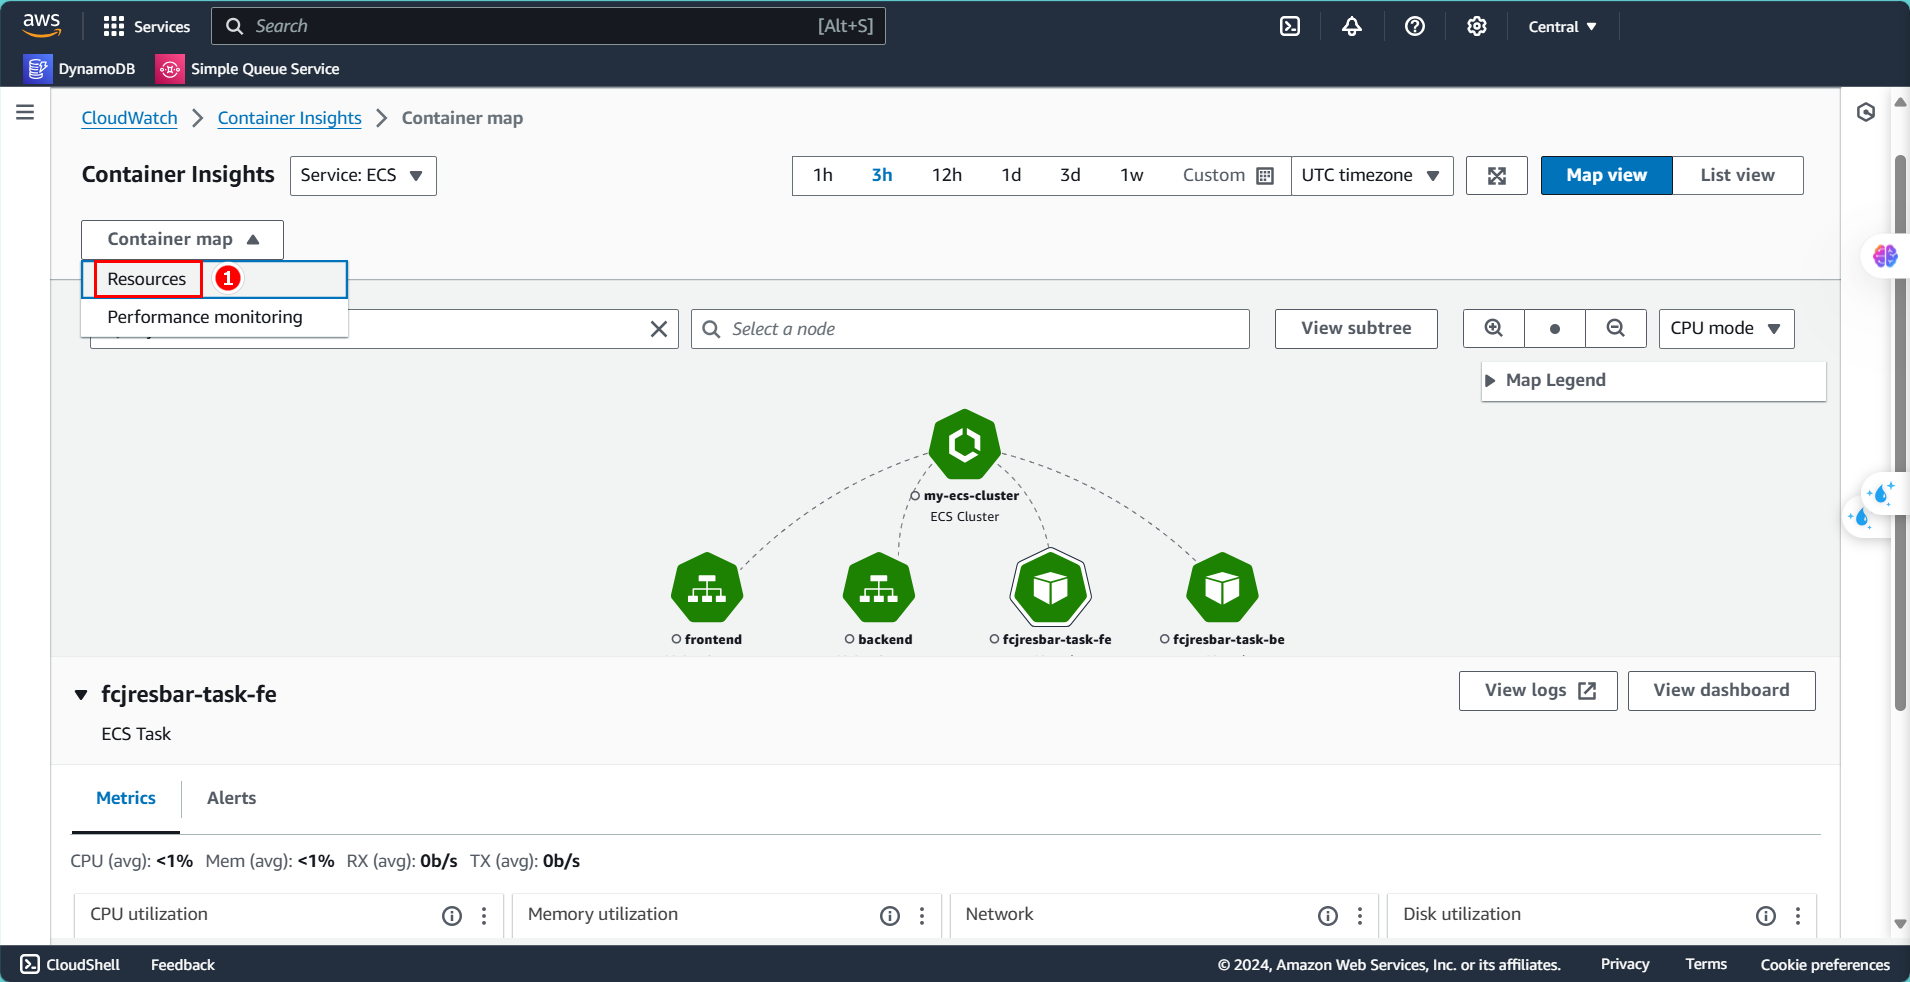
Here, you’ll see a list of created events, allowing you to select and monitor each service.
We have completed configuration and monitoring with Container Insights, but AWS provides other monitoring and tracking services beyond Container Insights, including third-party services.
Congratulations on completing this Workshop!